An introduction to the Order Book
One of the essential tools for crypto trading, along with candlestick charts.
Trading - The Basics of All Charts
How do signals come about in bitcoin trading? Signals are rooted in the supply and demand for a particular asset: If the demand increases, the price increases.
Charts, patterns, trends, and indicators are ultimately created by constantly buying and selling an asset. They can be seen in the progression of individual transactions.
Order Book - What Price Should I Buy and Sell Bitcoin?
How do buys and sells occur, and how do prices evolve? First, a buyer must know the price at which he is willing to invest in an asset. The same can be said about a seller: what price is he willing to part with his value investment?
People who want to get in or out of a price quickly like buying and selling at the most favorable price for the other party. Accordingly, many jump up or sell their investment at the last price.
If that were all, all purchases and sales would correspond to the last price in each case - if any trading occurs at all. The overall price would not change at all.
Who are the Different Parties in the Market
However, there are other parties in the market:
- buyers who are convinced that the asset is undervalued. They, therefore, want to get in as quickly as possible, even at a price that is higher than the current market price.
- buyers who believe that the price is currently overvalued. Nevertheless, they are willing to get in at a price below the current market price.
- sellers who think the asset is currently undervalued but consider a certain price level above acceptable current market price.
- sellers who believe the asset is overvalued are willing to sell at a price below the current market.
Finally, the volatility of the exchange partner must also be considered. This may still be relatively stable for exchanges between cryptocurrency and fiat. However, for value pairs such as Bitcoin/Ethereum, an increase in the price of Bitcoin may result in a relative decrease in the value of Ethereum.
These parties are trading with each other. Each has its plan, its assessment of the actual value of an asset, and its time scale that it considers in its analysis and decisions.
By the way, at this point, you can learn that the trading wisdom that in a good trade, the opposite side always loses, i.e., that you make a profit at the expense of market losers, falls short. Of course, this assumes that everyone has the same intention in the same time frame. To put it less abstractly: a day trader will assess an asset differently than a long-term investor.
How Do They Emerge on Markets
Back to the order book: The different parties mentioned can generate buy and sell orders or respond to existing ones, regardless of the market price. An order book then looks as follows:
As can be seen, a distinction is made between bids and asks. Bids are the purchase prices that buyers of the second group listed above are willing to pay. Asks complement the selling prices, which sellers of the third group find acceptable.
Market participants of the first and fourth groups are generally persons whose positions exchange partners are willing to accept quickly. Often these are lucrative deals for the exchange partner, which are also partly already available as a position, i.e., Ask or Bid. The buy and sell prices are specified in the considered value pair in BTC.
In addition to the indication of the bid and ask prices, the asset quantity is listed in these lists. So, for example, under "Size (ETH)," one can see how many ETh tokens are bought or sold in BTC for the price specified under Bid or Ask, respectively.
The equivalent value in BTC for this sum of ETH tokens is listed under "Total," while a cumulative sum is formed under "Sum." This cumulative sum is formed for bid prices by adding up the total values of all more expensive bid orders with the full value of the price under consideration. Similarly, in the case of ask prices, the sum of all total values for less expensive ask orders and the total value of the considered ask order is formed.

Buy and Sell Walls - What the Market Depth Reveals
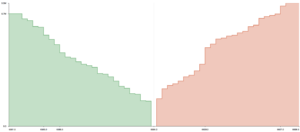
Even though such a representation lists the specific bid and asks orders in a sorted manner, it is sometimes difficult to grasp. Therefore, a graphical representation of the order book has become established, the so-called Market Depth.
This is called a buy wall when there are a lot of buy orders in the queue. It won't be easy to undercut this price, as a certain amount of orders must first be fulfilled for this to happen. Something analogous can occur with Ask orders. Here we speak of a Sell Wall. Large sell walls keep the price down accordingly.
Spoofing and Walls
These walls can be used deliberately. Especially with smaller altcoins, there are quite a few big players on the market who set corresponding walls to influence the trading behavior of the others. This process is known as spoofing. Accordingly, these walls, similar to supports and resistances, do not guarantee a hundred percent, but they can support a (mis)purchase decision.
The post What is an Order Book? An Important Tool for Traders appeared first on Fat Pig Signals.
https://ift.tt/HR2NzYJ3q

Nenhum comentário:
Postar um comentário